
Many partners, many data: how to understand a car’s behaviour PT.2
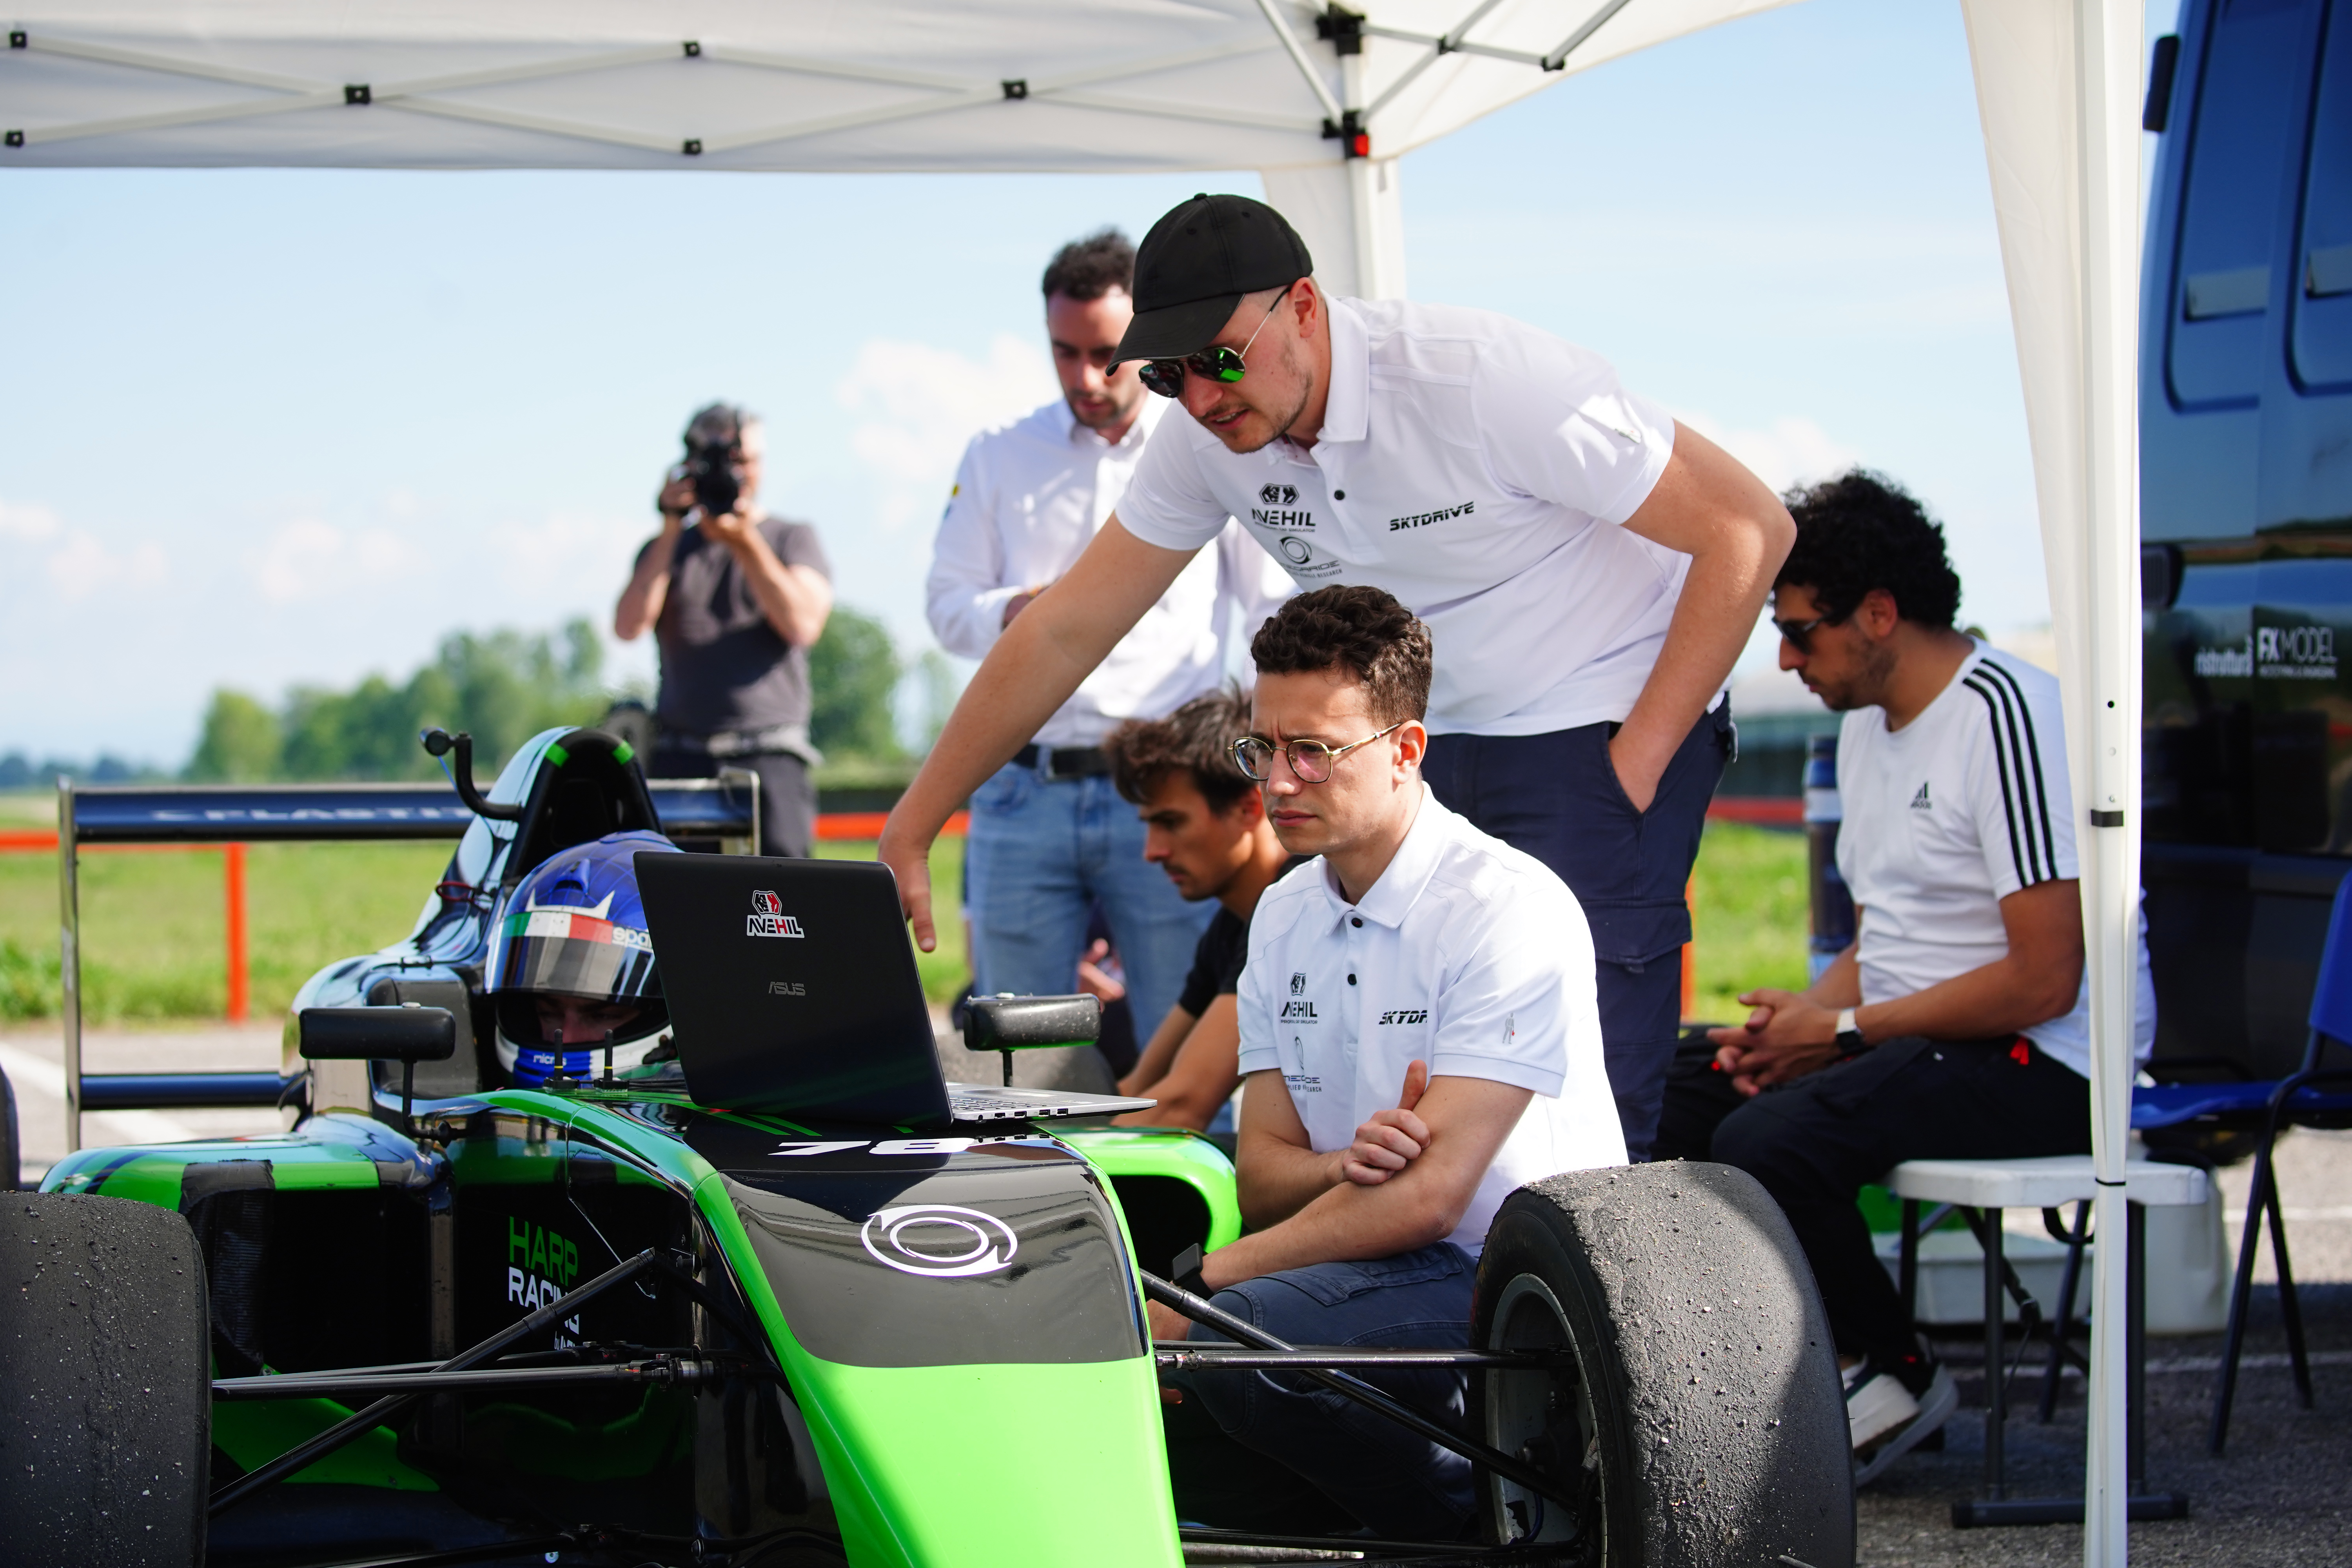
In Part 1 of this paper we have introduced the car and the instrumentation used. It’s now time to hit the track!
✵
THE WORK PLAN
The target is to simulate typical Qualyfing and Race condition, considering the rules constrain but also acquiring data during specific sliding maneuvers on new and used tyres, up to 200 km.
THE RUN PLAN
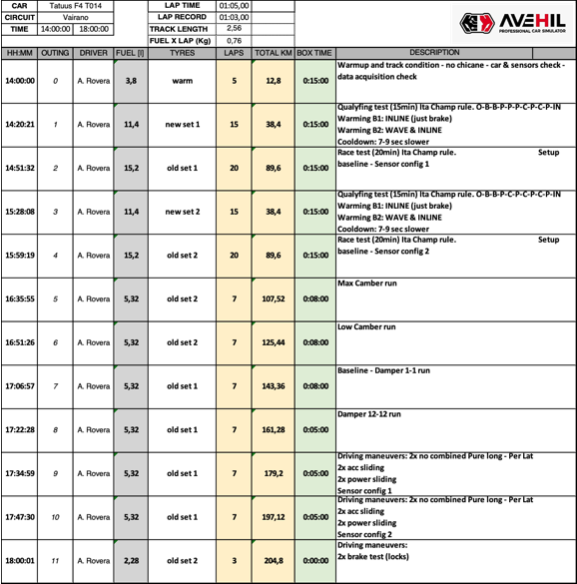
It started with a RUN 0 for the general warm-up of the car and checking the correct calibrations/functioning of the entire set of sensors and loggers. This first run is carried out on used tyres and for a limited number of laps (only 5), without any push lap.
Once this installation and warm-up session is over, it’s time to get serious, and the driver can finally begin to have fun with a qualifying simulation.
Obviously nither the absolute performance of the car, nore that one of the driver, are the goal of this simulation.
We payed great attention to analyse the tyre warm-up procedures, the cool-down procedures, the performance of the tyres – on new and old tyres.
The well-defined warming procedure: with new tyres, a sequence of laps is carried out with some specific driving techniques; initially warming-up only via the brake and thus the transmission of heat from the rim to the tyre-system, then following a repeatable sequence of wavings.
This is followed by push laps, cool down, more push laps.
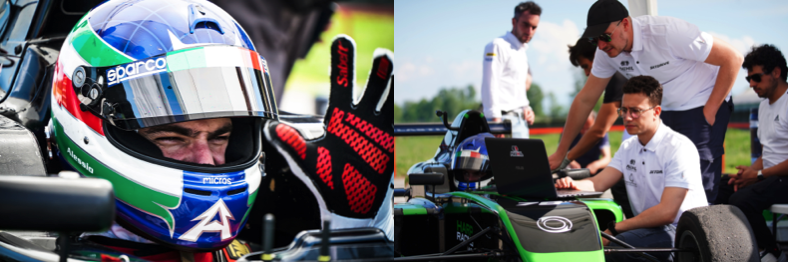
A very delicate task is required to the driver himself. In addition to correctly executing the procedures assigned, during the push laps he must be able to squeeze everything out of the tyre, pushing the envelope to the limit. Mistakes are not allowed since that would invalidate the data.
Hence the need to assign this task to a reliable and fast driver like Alessio.
This is followed by a race simulation on the same set of tyres, meaning after a heating cycle.
The evolution of temperatures is carefully measured, the changing in car behaviour as consumption increases, how the “relationship” between tyre and car varies as the kilometres go by, etc.
And then again: alternating different sets of tyres, different warm-up procedures, as well as alternating push, cool down and a couple of setup changes to enhance the aftermath on the tyres.
And more; when the driver is expressly asked to go beyond the limit of the tyre, in essence mistreating it, so as to highlight as much as possible, for example, lateral sliding or other extreme behaviours of the tyre.
CONCLUSIONS – NEXT STEPS AND DEVELOPMENT

A total of 307 kilometers (120 laps) were covered in constant weather conditions.
All the phases of the test have been completed successfully, managing to acquire all the necessary data.
A. The load and stiffness of the tyres at various mileage and temperatures (stat. T 100°);
B. The real slip at top performance;
C. Pure longitudinal and lateral slip;
D. The shape and size of the contact patch;
E. Relate the tyres’ temperature and the effective load
F. Estimate the core temperature of tyres during operation.
This huge amount of data, after a long analysis sessions, weeks of dedication and some professionalism – will massively improve knowledge of the racing vehicle, crucial point for the students of Master in Race Engineering of University of Pavia, at their special conclusive test after eight days on-track training and numerous simulation session: they are now ready to begin their professional career in motorsport.
Not only this, but there’s also much more. This car is out of production and has been replaced by the Tatuus F4 T421, however it inherits the constructive philosophy, the power train, gearbox and most of the main technical solutions.
So a very deep understanding even of the new car’s generation is possible. An interesting challenge is to find out a bond between tyres temperature/pressure and load.
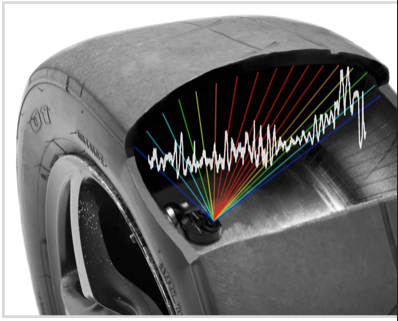
With the IZZE Racing HS-TTPMS sensors fitted inside the rims, we acquired and record live time data about the bulk, the inner-liner temperature and pressure with high accuracy and ultra-sensitive pressure transducer on 16 points of the carcass. In this way we should be able to define the CPLV – the Contact Parch Load Variation – comparing to the load measured with the strain-gauges mounted on each push-rod.
Correlation between load and contact patch shape and dimensions is the final target! But also comparing the tyres data inside and outside (surface vs inner-liner) we will be able to estimate the core temperature which is, now a days, the key factor of the magic word of motor racing: GRIP.
Again, as consequence, we want to be able to deliver to teams and drivers a clear methodology to understand how the warm up and cool down really works, which is the better procedure to do it, to identify the perfect temperature window for optimal adhesion and hysteresis and what kind of consequences wear has on car performance.
It’s that enough for you? Maybe, but not for us!
An accurate knowledge of the physics will allow a validation of the mathematical models currently in use. Once the data is checked, will lead to an implementation of the Avehil’s simulation platform, with very significant elements in order to reflect correctly EACH aspect of the real vehicle, the methods and the comparison with real data.
Avehil’s simulation platform, as the whole motorsport, is based on data and validation. The big difference in the market is that Avehil’s system is based on first-hand data, from real track, real cars and top level instrumentation.
But we must remember that all these figures don’t mean much without our collaborators, drivers, companies been involved, resulting in a meticulous and professional work.
Do you know anyone that can do better?